Dataset Helpers
Overview
TorchXRayVision provides several utilities for combining, filtering, and
pre-processing datasets. These tools are designed to work seamlessly with
any class that inherits from xrv.datasets.Dataset.
A typical multi-dataset workflow looks like this:
import torchxrayvision as xrv

d1 = xrv.datasets.NIH_Dataset(imgpath="/path/to/nih")
d2 = xrv.datasets.CheX_Dataset(imgpath="/path/to/chexpert")

# Align label columns across datasets
xrv.datasets.relabel_dataset(xrv.datasets.default_pathologies, d1)
xrv.datasets.relabel_dataset(xrv.datasets.default_pathologies, d2)

# Merge into a single iterable
d_all = xrv.datasets.MergeDataset([d1, d2])
Combining Datasets
- class xrv.datasets.MergeDataset(datasets, seed=0, label_concat=False)
The class MergeDataset can be used to merge multiple datasets together into a single dataset. This class takes in a list of dataset objects and assembles the datasets in order. This class will correctly maintain the .labels, .csv, and .pathologies fields and offer pretty printing.
dmerge = xrv.datasets.MergeDataset([dataset1, dataset2, ...])
# Output:
MergeDataset num_samples=261583
- 0 PC_Dataset num_samples=94825 views=['PA', 'AP']
- 1 RSNA_Pneumonia_Dataset num_samples=26684 views=['PA', 'AP']
- 2 NIH_Dataset num_samples=112120 views=['PA', 'AP']
- 3 SIIM_Pneumothorax_Dataset num_samples=12954
- 4 VinBrain_Dataset num_samples=15000 views=['PA', 'AP']
- class xrv.datasets.FilterDataset(dataset, labels=None)
- class xrv.datasets.SubsetDataset(dataset, idxs=None)
When you only want a subset of a dataset the SubsetDataset class can be used. A list of indexes can be passed in and only those indexes will be present in the new dataset. This class will correctly maintain the .labels, .csv, and .pathologies fields and offer pretty printing.
dsubset = xrv.datasets.SubsetDataset(dataset, [0, 5, 60])
# Output:
SubsetDataset num_samples=3
of PC_Dataset num_samples=94825 views=['PA', 'AP']
For example this class can be used to create a dataset of only female patients by selecting that column of the csv file and using np.where to convert this boolean vector into a list of indexes.
idxs = np.where(dataset.csv.PatientSex_DICOM=="F")[0]
dsubset = xrv.datasets.SubsetDataset(dataset, idxs)
# Output:
SubsetDataset num_samples=48308
- of PC_Dataset num_samples=94825 views=['PA', 'AP'] data_aug=None
Label Alignment
Before merging datasets that were labelled with different pathology sets,
use xrv.datasets.relabel_dataset to reorder (and
optionally pad with NaN) the label columns to a common list.
- xrv.datasets.relabel_dataset(pathologies, dataset, silent=False)
This function will add, remove, and reorder the .labels field to have the same order as the pathologies argument passed to it. If a pathology is specified but doesn’t exist in the dataset then a NaN will be put in place of the label.
- Args:
- pathologies:
The list of pathologies that the dataset will be aligned.
- dataset:
The dataset object that will be edited.
- silent:
Set True to silence printing details of the alignment.
Image Transforms
These transform objects are compatible with
torchvision.transforms.Compose and operate on the (1, H, W)
float32 NumPy arrays returned by dataset __getitem__ calls.
- class xrv.datasets.XRayCenterCrop
Perform a center crop on the long dimension of the input image
- class xrv.datasets.XRayResizer(size: int, engine='skimage')
Resize an image to a specific size
Covariate Shift Simulation
- class xrv.datasets.CovariateDataset(d1, d1_target, d2, d2_target, ratio=0.5, mode='train', seed=0, nsamples=None, splits=[0.5, 0.25, 0.25], verbose=False)
A covariate shift between two data distributions arises when some extraneous variable confounds with the variables of interest in the first dataset differently than in the second [Moreno-Torres et al., 2012]. Covariate shifts between the training and test distribution in a machine learning setting can lead to models which generalize poorly, and this phenomenon is commonly observed in CXR models trained on a small dataset and deployed on another one [Zhao et al., 2019; DeGrave et al., 2020]. We provide tools to simulate covariate shifts in these datasets so researchers can evaluate the susceptibility of their models to these shifts, or explore mitigation strategies.
d = xrv.datasets.CovariateDataset(
    d1 = # dataset1 with a specific condition.
    d1_target = # target label to predict.
    d2 = # dataset2 with a specific condition.
    d2_target = #target label to predict.
    mode="train", # train, valid, or test.
    ratio=0.75
)
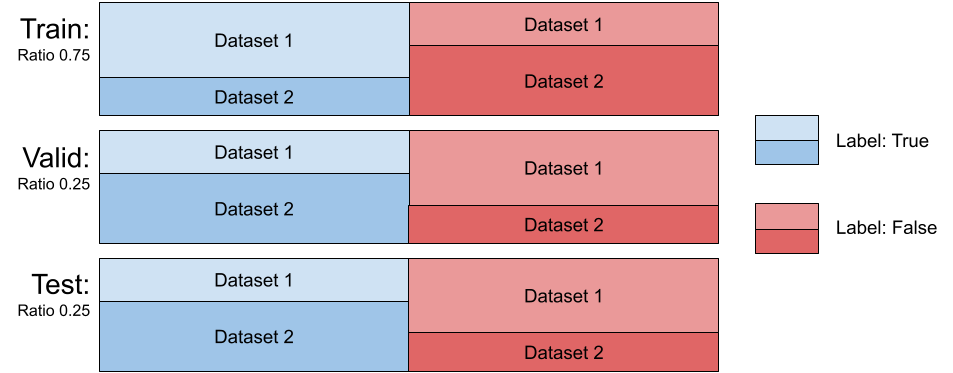
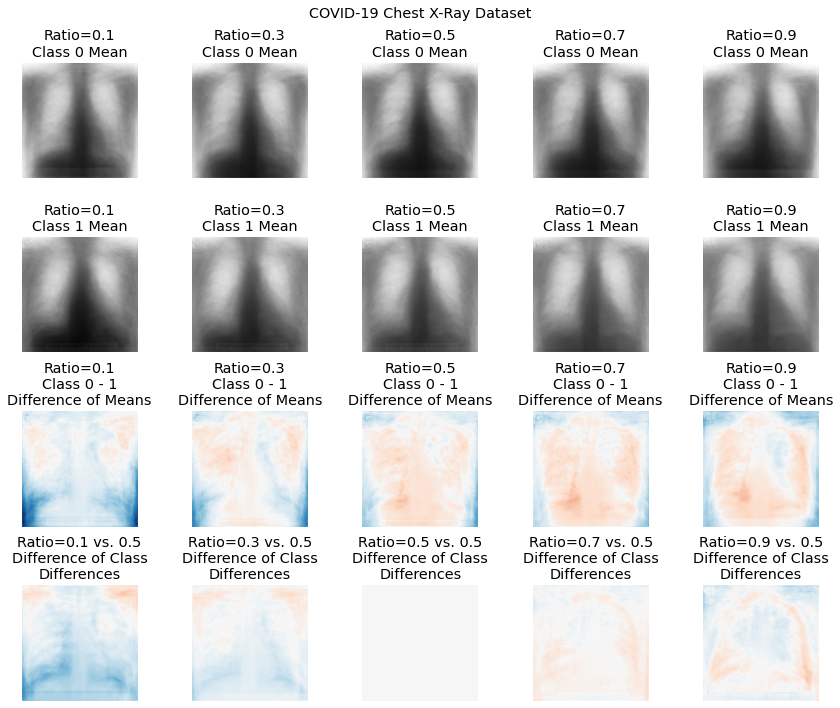
The class xrv.datasets.CovariateDataset takes two datasets and two arrays representing the labels. It returns samples for the output classes with a specified ratio of examples from each dataset, thereby introducing a correlation between any dataset-specific nuisance features and the output label. This simulates a covariate shift. The test split can be set up with a different ratio than the training split; this setup has been shown to both decrease generalization performance and exacerbate incorrect feature attribution [Viviano et al., 2020]. See Figure 4 for a visualization of the effect the ratio parameter has on the mean class difference when correlating the view (each dataset) with the target label. The effect seen with low ratios is due to the majority of the positive labels being drawn from the first dataset, where in the high ratios, the majority of the positive labels are drawn from the second dataset. With any ratio, the number of samples returned will be the same in order to provide controlled experiments. The dataset has 3 modes, train sampled using the provided ratio and the valid and test dataset are sampled using 1−ratio.
An example of the mean class difference drawn from the COVID-19 dataset at different covariate ratios. Here, the first COVID-19 dataset consisted of only AP images, whereas the second dataset consisted of only PA images. The third row shows, for each ratio, the difference in the class means, demonstrating the effect of sampling images from the two views on the perceived class difference. The fourth row shows the difference between each ratio’s difference image, and the difference image with a ratio of 0.5 (balanced sampling from all views).
Citation:
Viviano, J. D., Simpson, B., Dutil, F., Bengio, Y., & Cohen, J. P. (2020). Saliency is a Possible Red Herring When Diagnosing Poor Generalization. International Conference on Learning Representations (ICLR). https://arxiv.org/abs/1910.00199